A result of long-term holders and a sense of underexposure
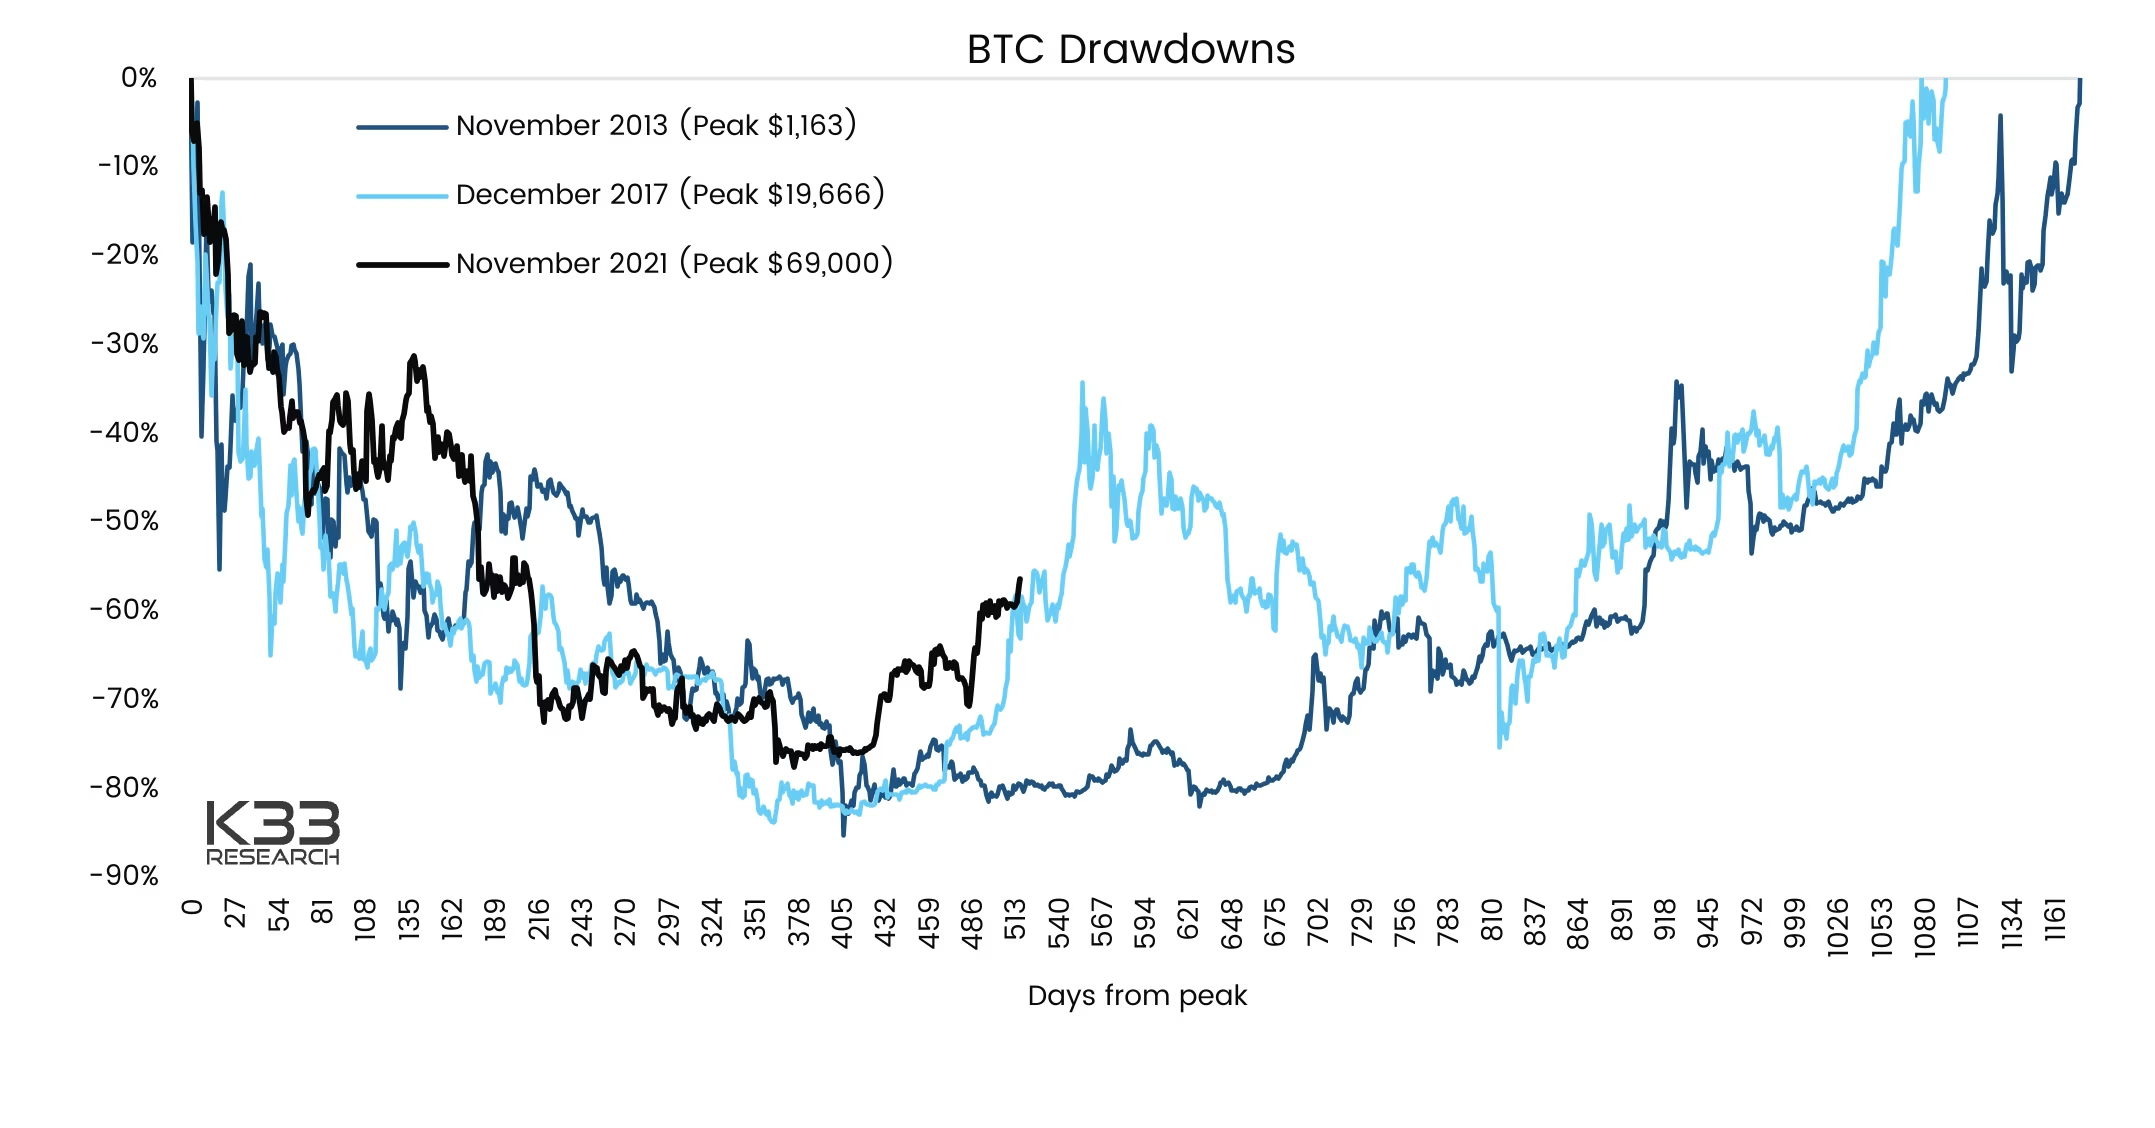
A satisfying explanation behind the resemblance is hard to put forward, but a pragmatic understanding of the typical BTC holder may help. Committed long-term holders are still unwilling to sell at a 60% drawdown from the previous peak and use these periods as accumulation periods. Additionally, the early 2023 rally has all the hallmarks of a hated rally - a rally where holders feel underexposed after a highly traumatic year, where investors de-risked in anticipation of further downside. The hated rally of 2019 ended with a significant blow-off top before BTC resumed trading at a 40-60% drawdown from its 2017 ATH.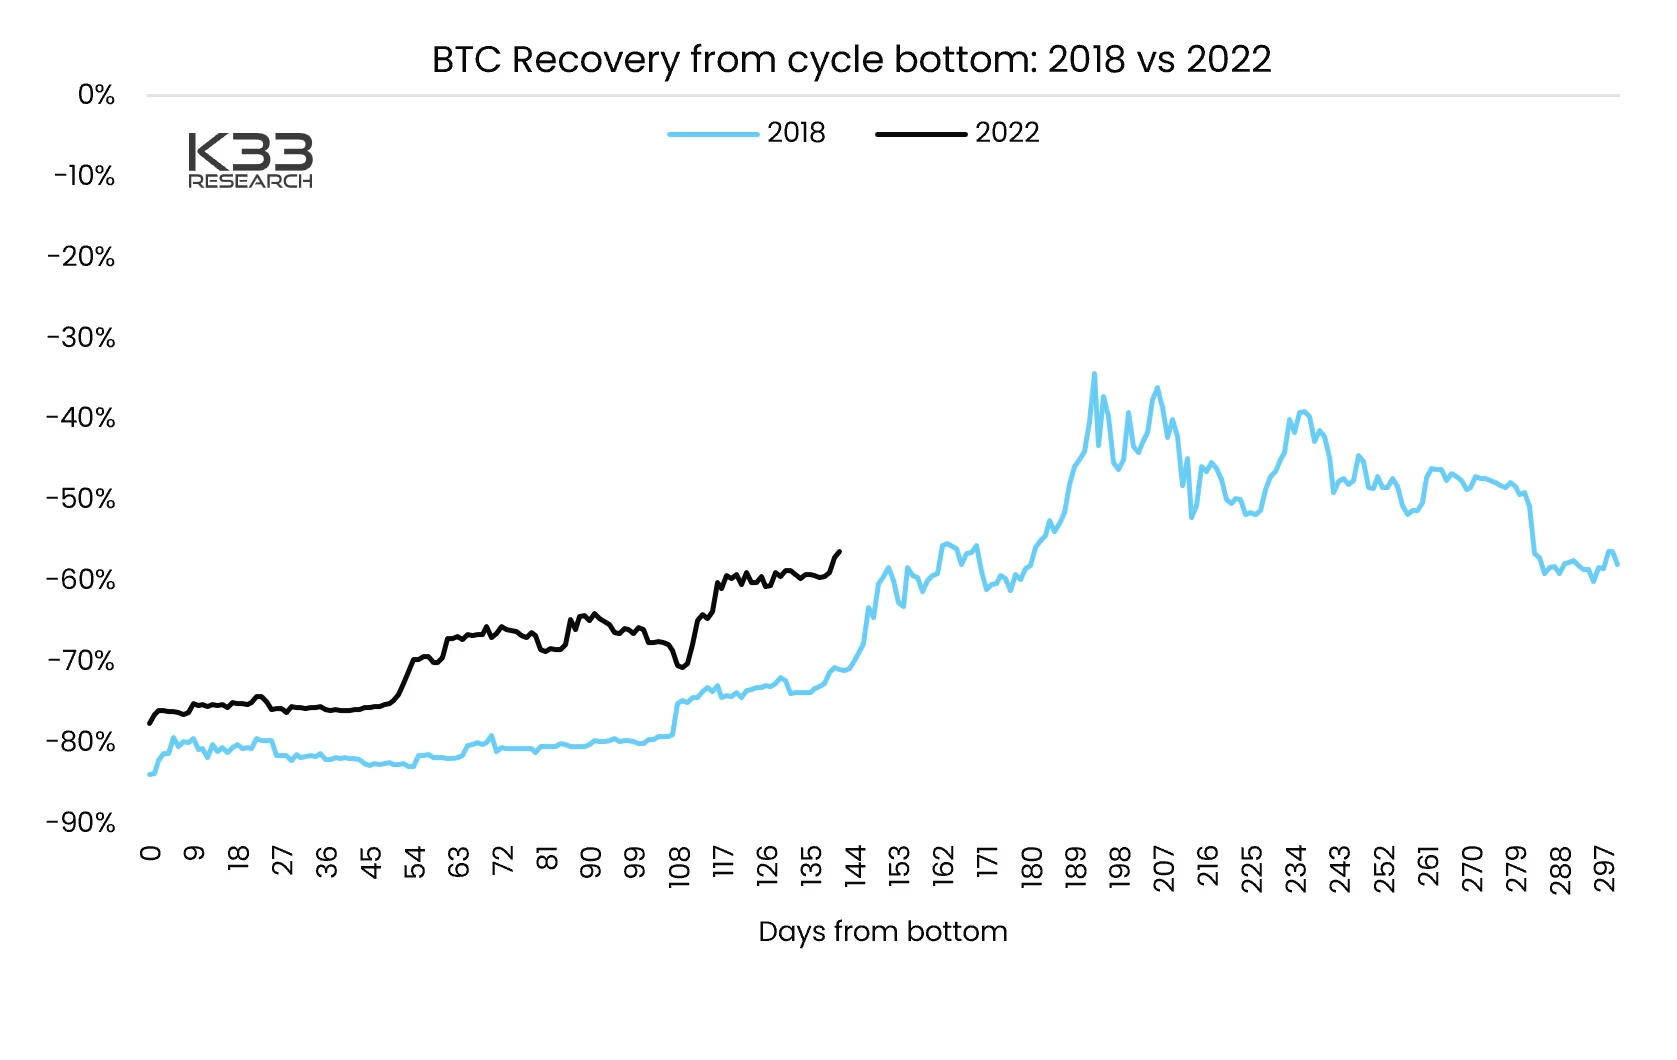
Preview