company-logoresearch-logo
15 Aug 2023

Trading idea: It's time to bet on volatility

The ear-deafening silence from the market throughout the summer of 2023 has pushed implied volatilities well below former all-time lows, reducing the costs of contrarian vol bets
Implied Volatility 2020 2023
Preview
The ear-deafening silence from the market throughout the summer of 2023 has pushed implied volatilities well below former all-time lows. A meltdown in realized volatility causes the declining IVs. As noted on page 3 in this week's market update, the 30-day volatility sits at lows not seen since 2016, and in Figures 16 and 17, we highlight the unprecedented lack of volatile days in the past year. The 3mth IV currently sits at 35. In October 2020, the 3mth IV pushed to a then-all-time low of 56 after 47 consecutive trading days without a 5% move as BTC stubbornly traded within a tight range at $10k. Current IVs are extremely shallow compared to the lows of 2020, with the 1y ATM IV sitting at 44. This regime represents promising opportunities for traders considering long volatility bets, as the costs of straddles are at uniquely low levels. A long straddle based on the 1y ATM expiry is an attractive option at the time being, representing an angle to bet on a changing regime within the next 365 days. Further, the cost of purely directional ATM call longs enables bullish traders to gain significant upside exposure at low costs. Within the next year, BTC will go through a new halving, with multiple ETF verdicts on the horizon, increasing the attractiveness of long-call exposure.
4 out of 5 low vol streaks since 2019 has occurred in the past 365 days
We define consecutive low volatility days as days in a row without a 5% move in BTC. The current streak sits at 53, with the longest low volatility period since 2019 lasting for 62 days, from November 11, 2022, to January 12, 2023.
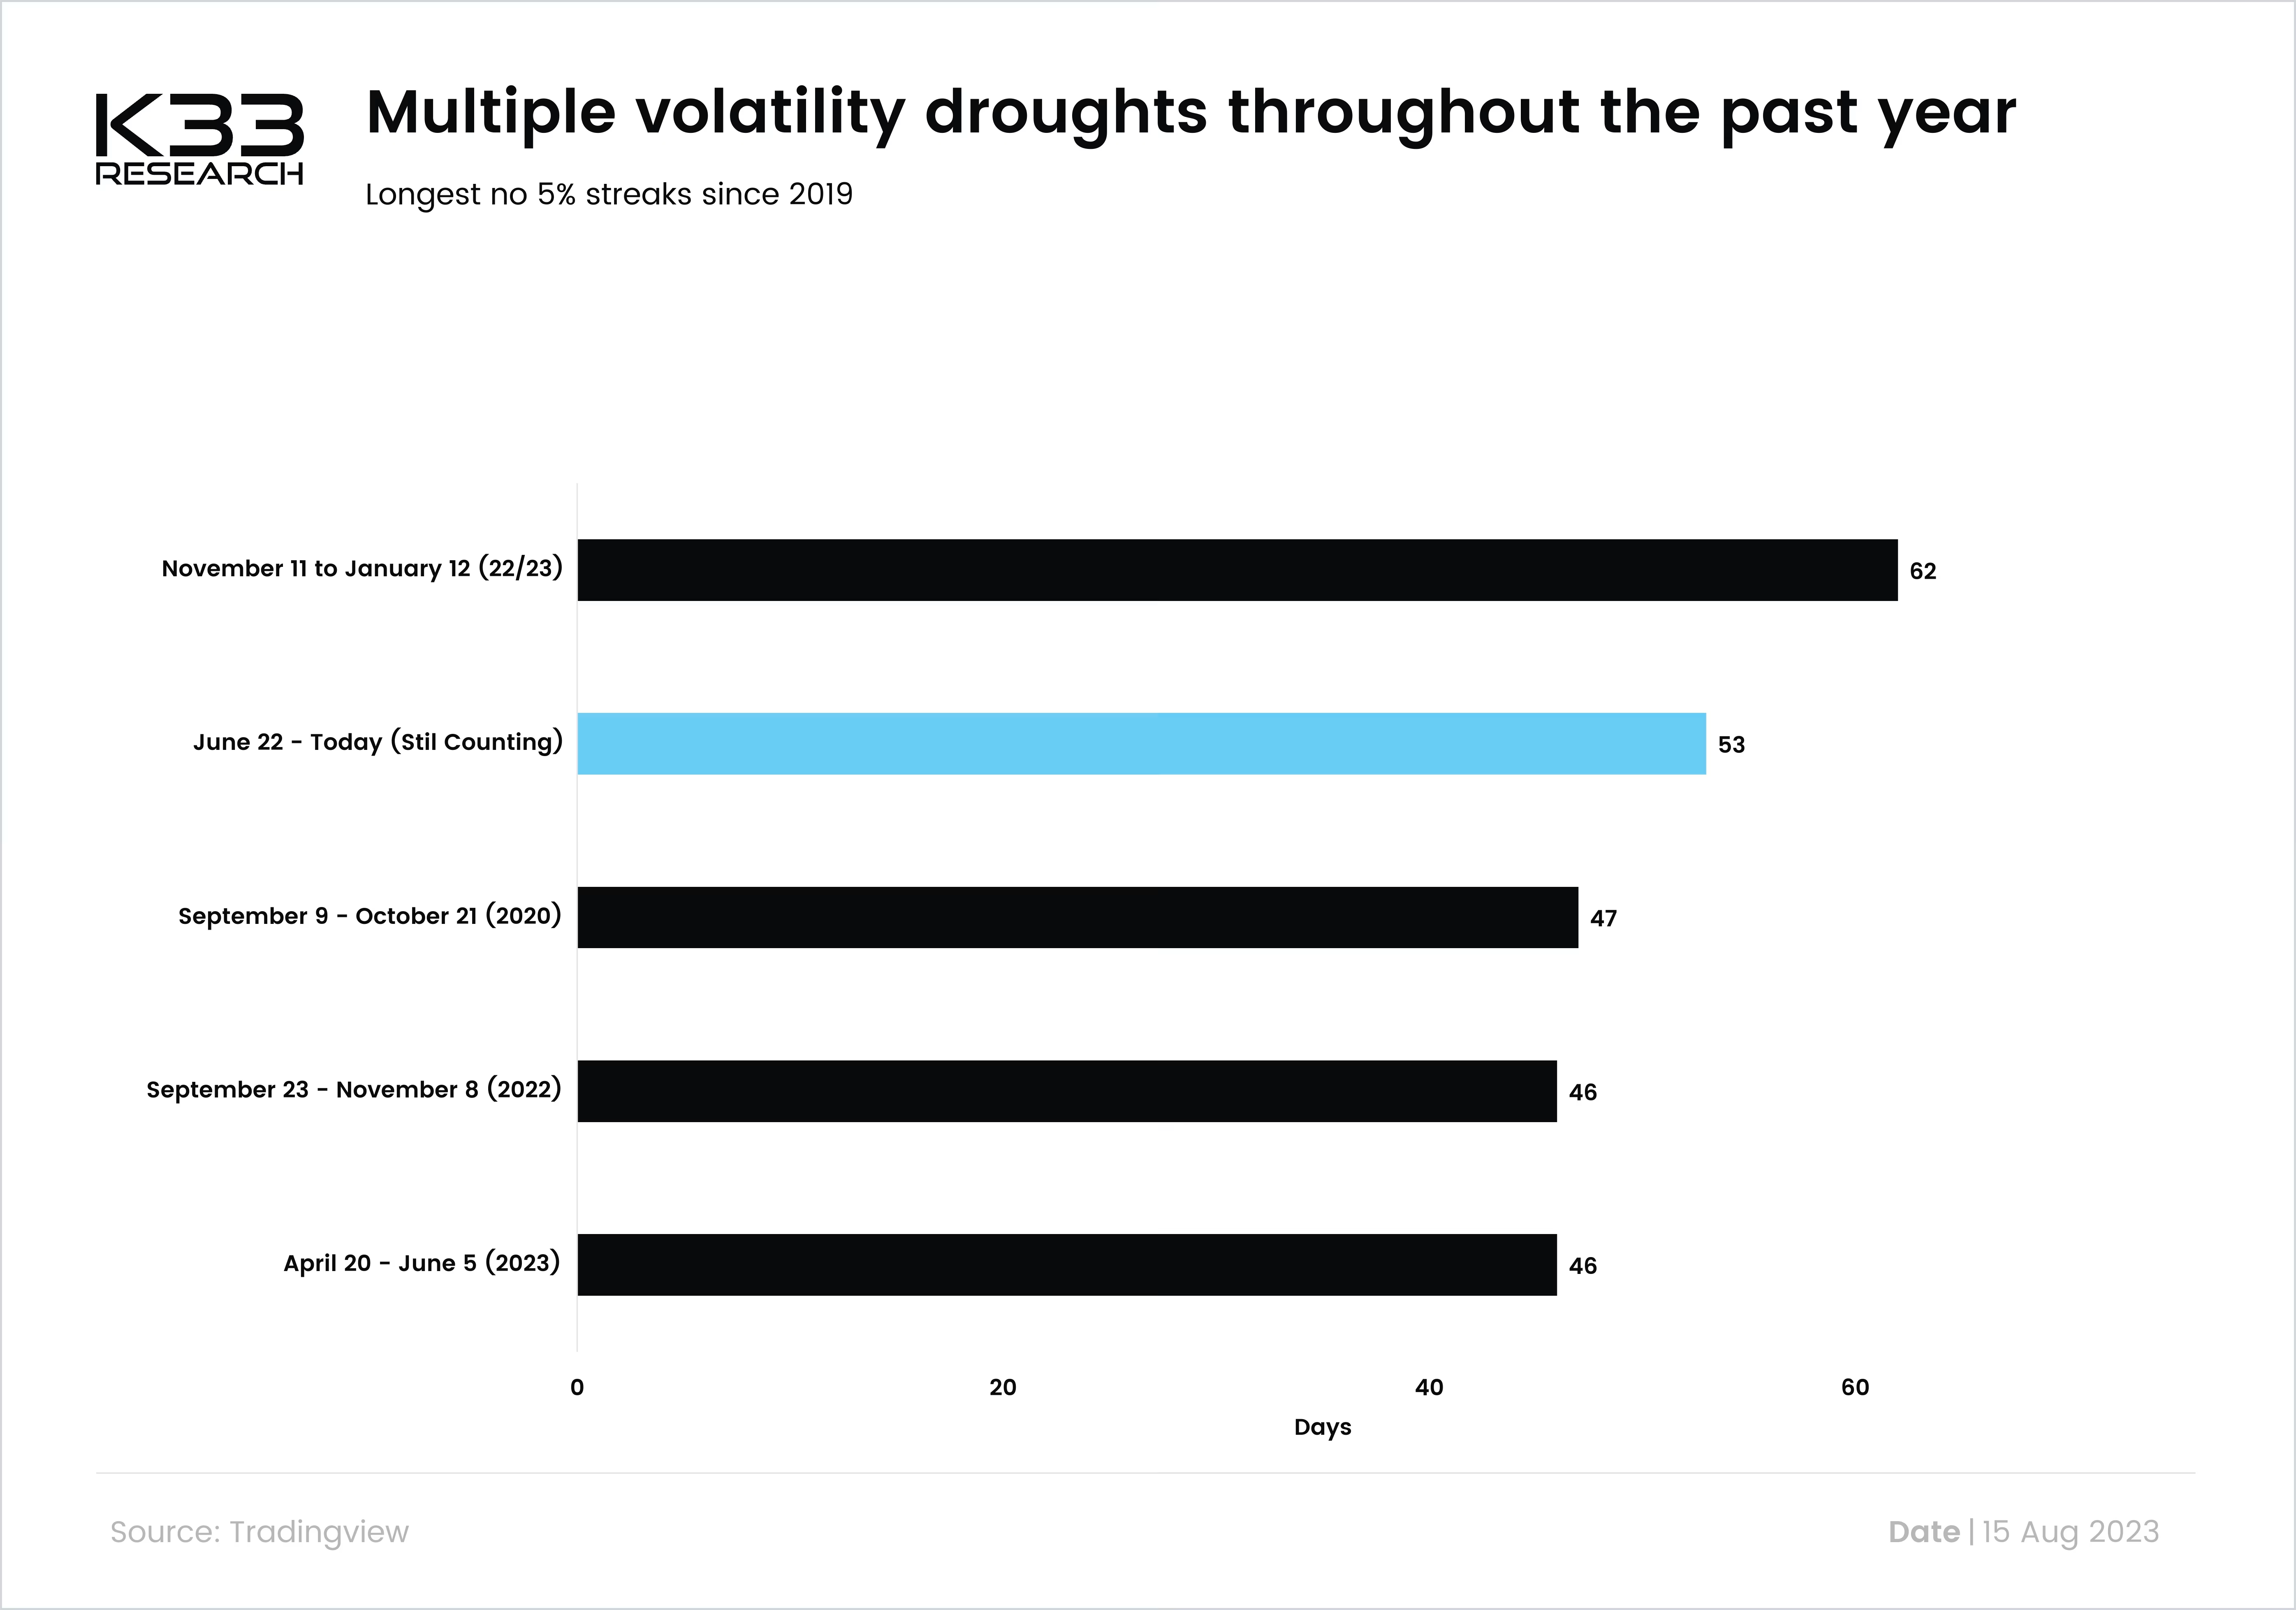
lengthiest period between 5 percent moves
Preview
The figure below illustrates the average amount of consecutive low-volatility days (daily volatility below 5%) per year. The 2023 average sits at 15.1, twice as high as the 5-year average from 2019 to 2023 and more than three times as high as the uniquely volatile 2021.
Average days between 5 percent move
Preview
Share this article