company-logoresearch-logo
27 Sep 2023

Paying Attention To CME Traders Can Pay Off

Short-time frame traders could benefit from paying close attention to CME activity, as data suggests it offers informational value regarding BTC’s performance ahead.
cover picture cme article SVG
Preview
When CME traders build directional exposure, BTC tends to move in accordance with the directional exposure on CME in the following days. We find that Bitcoin, on average, has seen a daily return of 0.65% (median: 0.39%) the day after growth in open interest and an increase in premiums. A similar pattern is clear when assessing returns for the next week, with BTC, on average, seeing a 0.9% weekly return after a day of rising premiums and OI on CME.Similarly, BTC has seen an average next-day return of -0.54% (median: -0.31%) on the day after a growing OI and declining basis, with similar results visible over a one-week horizon. Interestingly, returns are, in general, flat in periods where open interest declines as CME traders reduce exposure.
CME next day return chart SVG
Preview
Using CME to forecast the price action of tomorrow
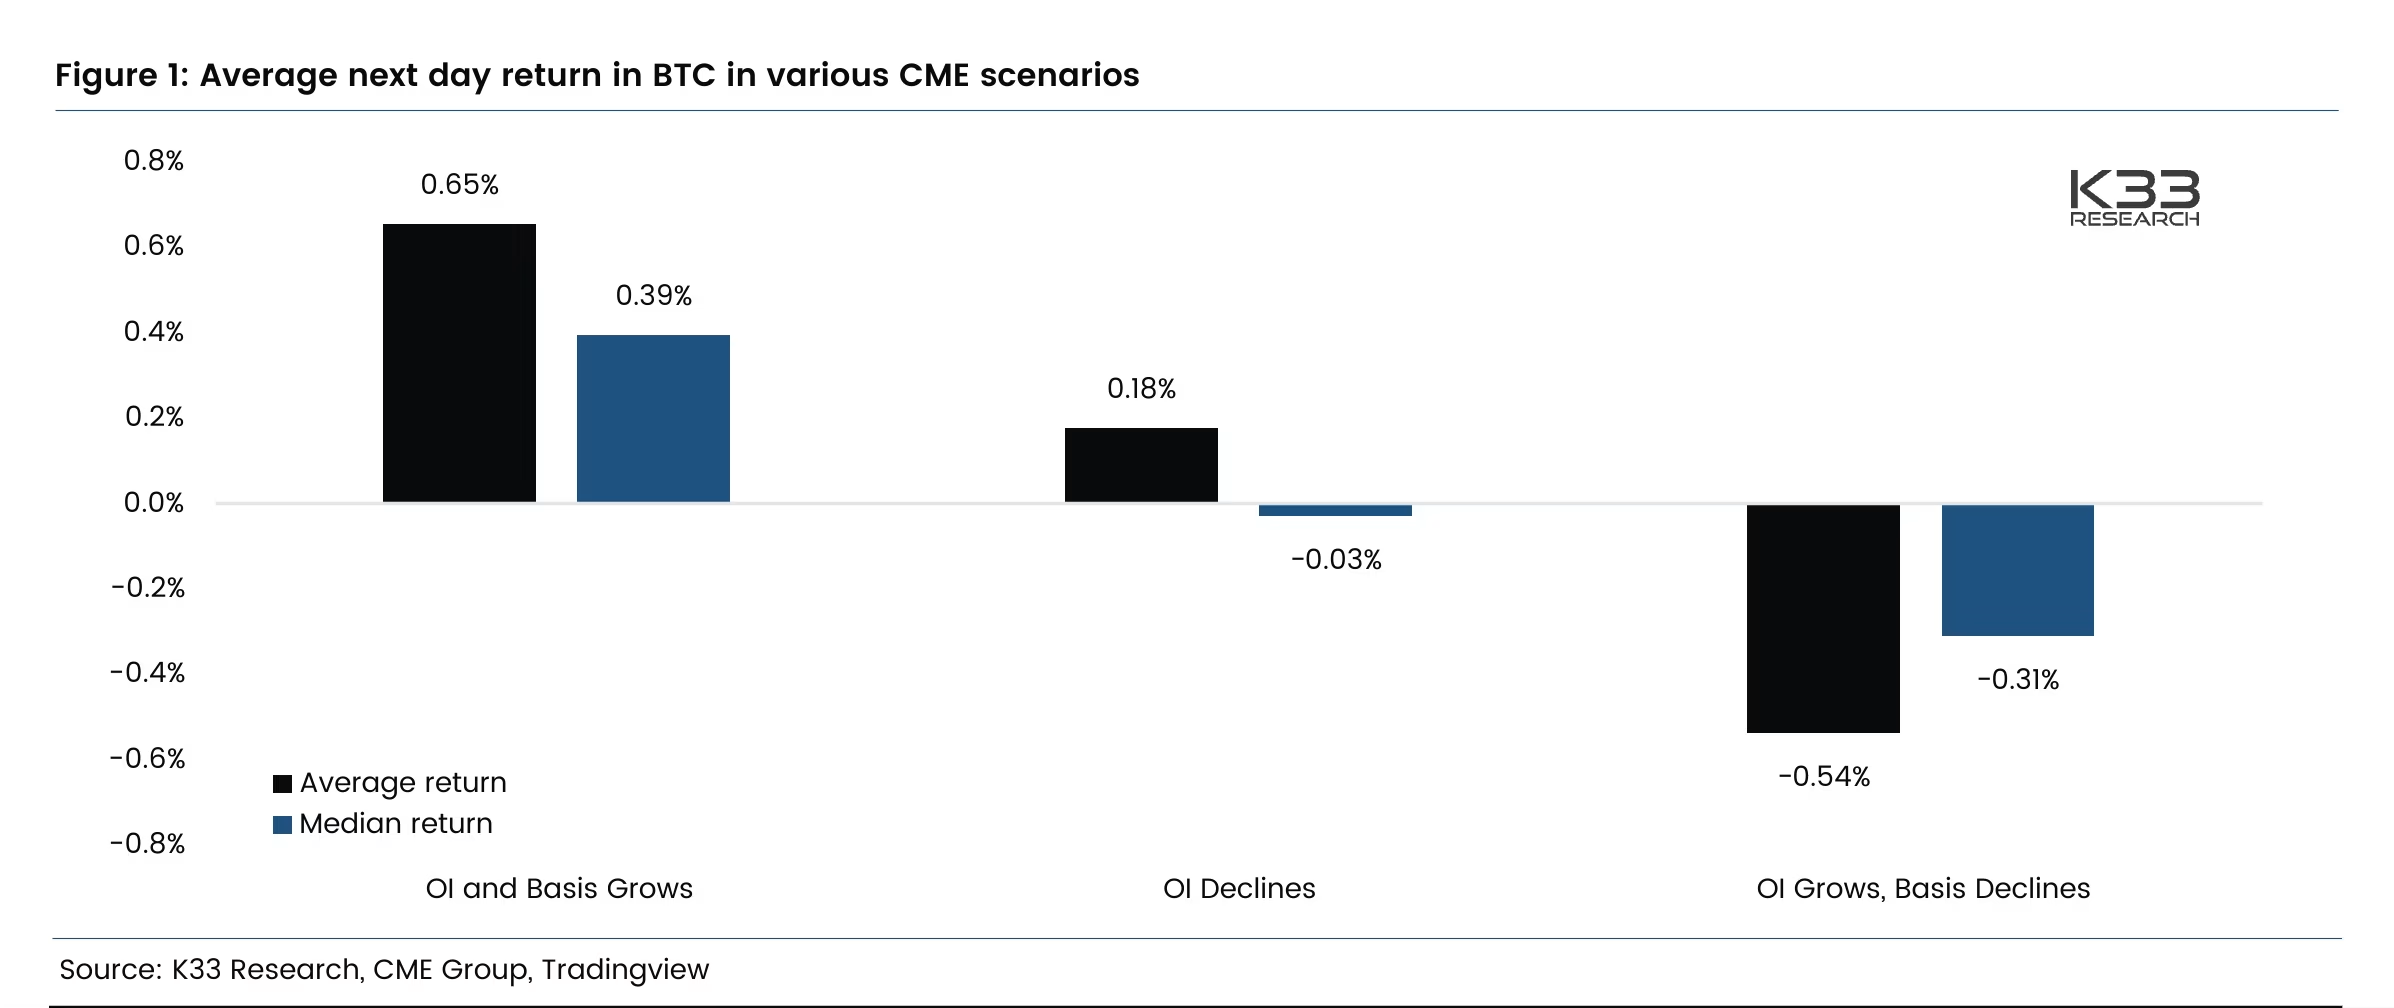
We use open interest as a proxy for CME exposure and the directional trend in futures premiums to pinpoint directional bias on CME. If the futures basis grows alongside growing open interest, CME traders have increased exposure, with longs being the key aggressor. Similarly, if open interest grows and premiums decline, traders have increased exposure, with shorts being the key aggressor.The relationship between directional aggression on CME and BTC price development is strong as evidenced above. Still, one must remember the relationship is not 1-to-1. Below, we illustrate the detailed data behind the findings above, with green representing bullish aggression on CME and red representing bearish aggression.
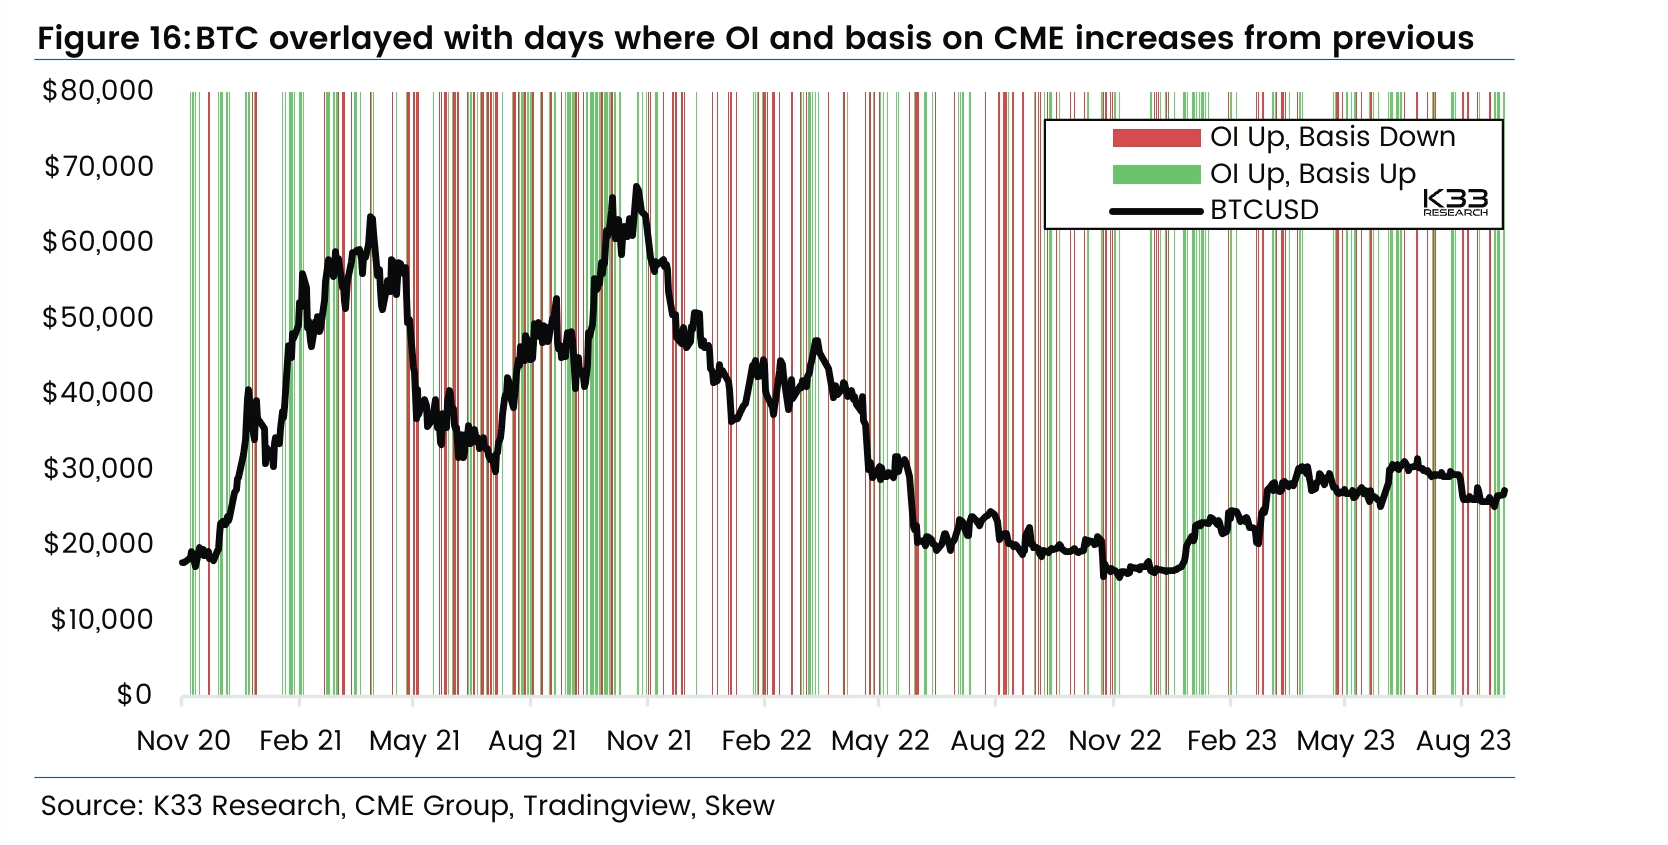
CME vs Bitcoin price SVG
Preview
Share this article